The computer vision platform at Chooch AI is scaling with our customer and partner engagement. In this webinar, we introduce an updated dashboard offering analytics, alerts, and insights. Read the entire Chooch AI Product Update webinar below.
Learn more about our computer vision platform from the Product page.
Here’s the transcript.
Vina:
Our API is organized around REST API. This allows our developers to programmatically communicate back and forth with our platform, but it’s just as easy to use as our UI. And also our API is compatible with live streams and live tagging, which is done through the user’s edge device, which brings up our next slide. When we talk about edge device, we refer to a locally placed server that you can run AI models on, which is OnPrem, not in the cloud and close to a video feed. On the dashboard view, there’s a list of devices ready for you to access. Within edge devices, you can manage your own camera streams, set up new devices, and deploy AI models. With edge devices, this is very useful when it comes to increasing privacy and security, since it is locally stored and it’s not in the cloud.
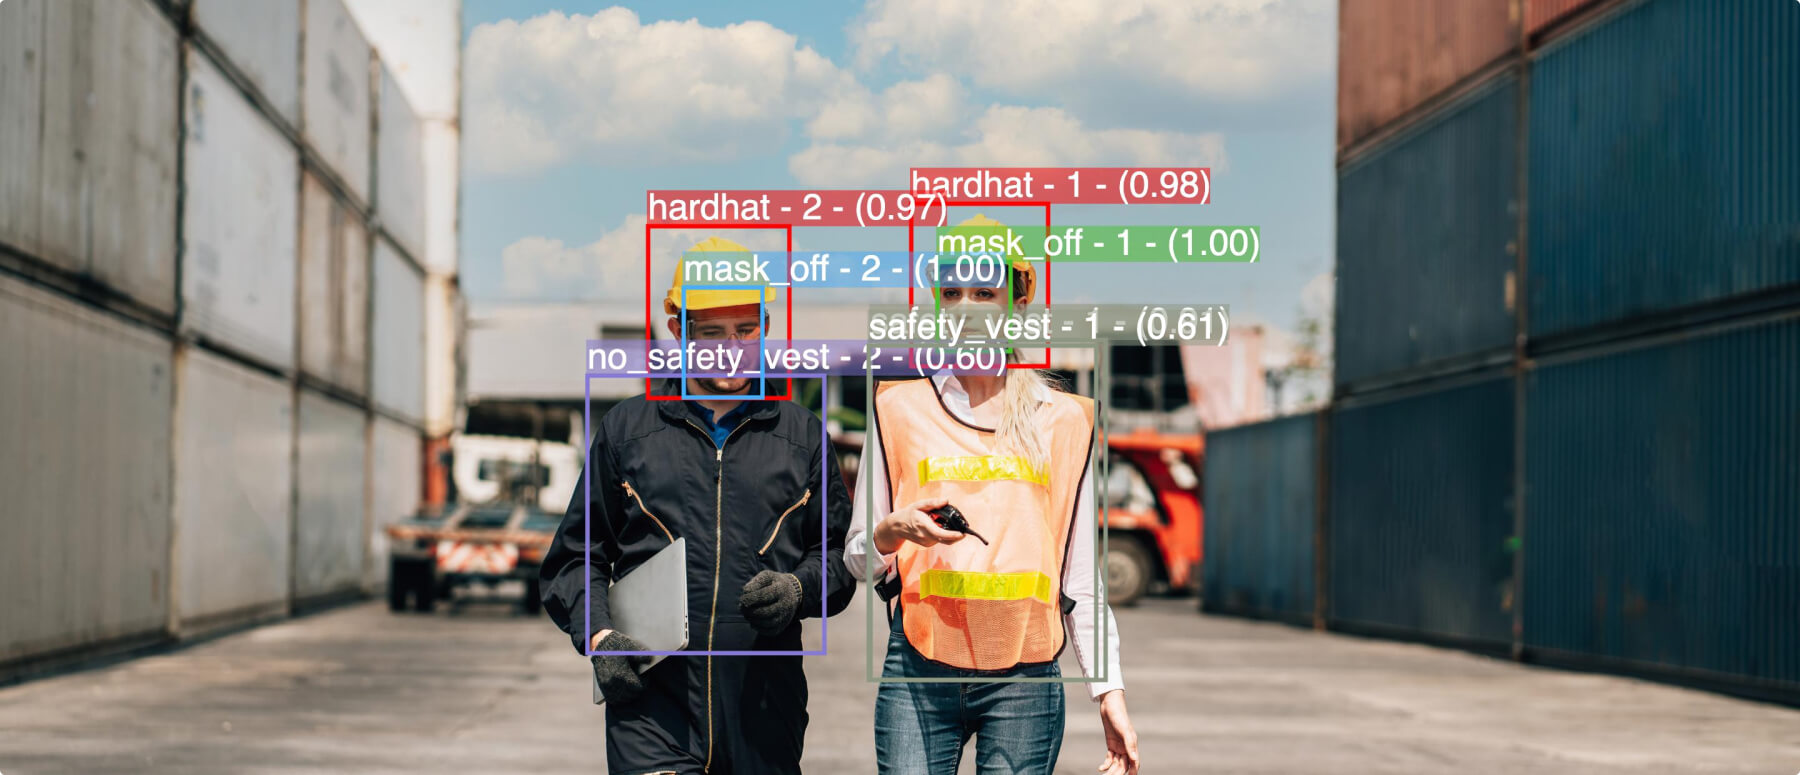
So what are some of these models, you’re asking? Our next slide for public models, Chooch has developed these models that allow you to quickly detect any object that you were looking for. Some examples of these public models is fire detection. Here in California, as we all know, we do have a lot of fires, especially detecting those small fires before it becomes massive fires. And then also we do smoke detection, which goes hand in hand with fire detection, as you can probably detect smoke before you can detect the fire. PPE detection, I think that’s really valuable, right now, especially in the workplace, making sure that your employees are wearing hard hats or safety vests or gloves, or even at the airports wearing a mask.
PPE detection is very valuable right now during this pandemic. We also have human fall detection, right? Making sure that you’re detecting, if your employee has fallen in the workplace, what type of actions do you need to take and also how to prevent that from happening again. So now that you’ve seen our public models, let me show you some of our dataset tools in our next slide. With dataset you can create your own custom models. As you can see here, we have some airplanes, which is part of our object detection model.
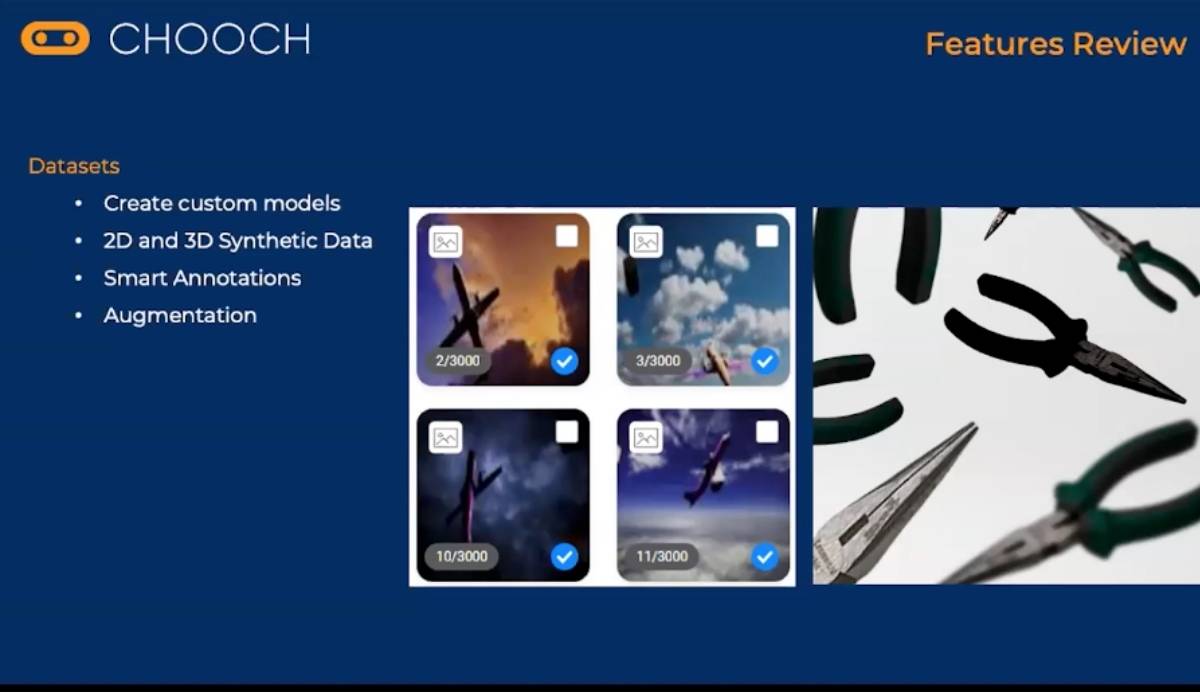
So 2D and 3D synthetic data. This is really helpful in helping generate different image viewpoints, object poses, backgrounds, and lighting conditions. As you can see in that screenshot, the airplane is seen in the daytime and also at night. So that’s different lighting conditions, and for generating different angles, such as like tools and machinery to identify different components and different parts of those tools or machinery. 2D and 3D synthetic data can also be really helpful in enhancing your dataset with images that are less common or hard to find. With smart annotations, you can use custom or public models to annotate additional objects within a dataset. Let’s just say you have a thousand images within your dataset, smart annotation will make it easier to detect those additional objects. With augmentation, you can make slight modifications to your images in a dataset by rotating, scaling, or cropping, as you can see the image of that airplane, there’s different angles.
Also with data augmentation Chooch provides the ability to copy and modify 2D objects, hundreds of times, to train the AI faster. Lastly, our next slide we’ll do a high level overview of some of our version four updates. So I’ll just highlight that now we have Kubernetes deployment, that’s supported. Our average inference speed has increased up to two times, and so this means that for a basic AI model, you can do 10 predictions within one second. We also support live streams from YouTube and M3U playlists, and we’ve also improve multiple streaming and inference features. So I’ll go ahead and pass this on to Peter who will now discuss more about our new analytics feature. Thank you.
Peter:
Thank you very much, Vina for that. Again, this is Peter now. Again, we’re going to go and talk a little bit more about the new analytics interface as well as our alerting configuration options, being able to change or manipulate, or provide a workflow on intelligence on what is and is not alarming from the system. From here we have on our analytic interface, we have the ability to view different predictions in the system. This again is a way to look at them in different graph or graphing interfaces, filtering them based on time or feed or model, and then also being able to manipulate based on time.
Okay, so here we see some examples of the different interface. On the top, we have our different filtering options. Again, we can choose based on device, so different edge component, which we’ll go in a little bit later. Per stream or camera stream, that’s our terminology for that. Different zones, which we’ll go out in a second again. Hey, different geofences within a video feed. Hey, loading dock, or another part of the interface, and then also events. So hey, I want to see only certain events. On the top right we can also see the different filtering on time. So instead of looking at it for all of time, maybe the last month or the last week, again, being able to filter and dial in this information within our interface. As you make these changes, you can see on the bottom an example of the line graph, but again, this can be changed. We can also see pie graphs or other manipulations like that.
And as part of this interface, we also are able to see the actual event or alert image as well. So for example, the first three pictures there, we see a geofence or zone, where a forklift or a person triggered that specific event in the system. And again, we grab a snapshot from that video feed and store it in the solution, and then for the other pictures there, we see an example of a retail situation where maybe a geofence or zone is drawn around a specific kiosk that we want to monitor activities there. So hey, a person came there, maybe they dwelled more than 60 seconds, again, we’re able to data mine that as part of our analytics here.
Okay, the next thing here is we’re going to look and talk about our rules interface. So now we’re able to provide a workflow or filtering methodology to define not only when do we get predictions, but then based on certain criteria. And so the first event here is, hey, from a model that we saw going to talk about our earlier, where we have some models that have upwards of a thousand different predictions in it, or again, if you create your own model yourself, you can go ahead and define that. But hey, within this interface, I only want to go ahead and look for the packages as part of a certain model. And so, hey, the first tab here is we define what annotation or label we want to grab from them.
And then the next tab… We see, hey, not only do we want to see its physic model triggered based on this prediction, but also a geofence. So in this example here, there’s this zone that was drawn around a loading dock, so when we see in this example here again, not packages, but hey, when a forklift comes into that zone, we want to get an alarm. And then on the last one we have rules.
And so in here within these different components, we’re able to also define temporal presence, proximity, and zones, which we saw a second ago. So temporal is time, presence is the amount of people or objects in that area, proximity is distance between, so like social distancing, like what we’re dealing with right now, and then lastly zones. So zone again, we saw it earlier. So what this ultimately means is all the different criteria between events, zones, and rules, would then trigger an event in our system. So we’re trying to filter out the noise, making things only pertinent based on what is actionable, based on the custom use case, things like that. And then we’ll pass on over to Omid to do a live demo of the system. Thank you very much.
Omid:
Awesome, thank you for that. Let me go ahead, share my screen. All right. All right, so we’re going to begin off with the dashboard. So this is the landing page when you first log into your Chooch dashboard. You’re going to see all of your API documentations, our platform guides, and our how-to videos right here on the right-hand side, and then you’ll also see quick navigational access on the top-hand side. If you scroll down to the bottom, you’ll see all of our latest updates, so what’s changed on the platform, and anytime we make new updates, you’ll be able to see that there as well as our API key. Now just kind of re-highlighting some of the points that our team has talked about. We want to touch on some of the public models real quick, so I can come here and we can go to our object detection models.
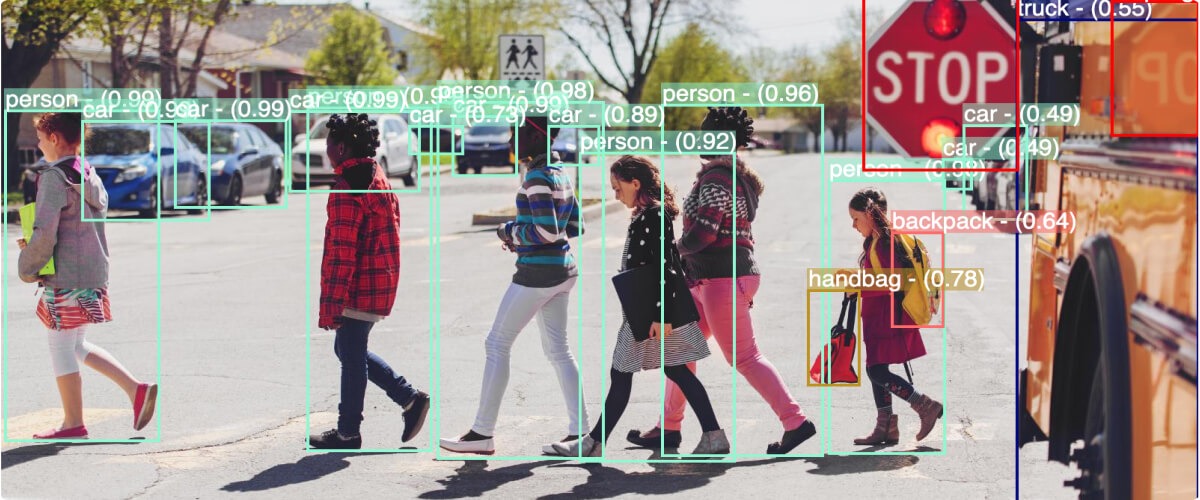
And here again is where you can quickly leverage our pre-built models out of the box. So there’s no customized development needed. These are ready to go. You can push these to your devices and be able to use them rapidly. You can note that some are very lightweight, they’ll have two classifications and I’ll get into what that means, but basically fall down or standing, and then we have some models that have over 11,000 classifications, like our general deep detection. So this is leveraging and detecting everything from phones to cells, to different actions like swimming, biking, climbing, it incorporates all these all into this one large model. Now there’s a lot of instances where users or customers may need their own custom developed model. So what we allow users to do is to develop those models, and our own team actually leverages as these tools in-house.
So if we go to our datasets tab here and we go to my object datasets… Here, you can see some models that we have started, some datasets that we have started annotating ourselves. And if you already have previously annotated datasets, what you can do is just hit upload dataset and upload that dataset as long as it’s in the COCO JSON format, with all the supporting images with it. Now I’m going to touch on this dataset here. This is one that we can all easily relate to, and it’s just on airplanes. Now, what you can see here is we have over 1,700 different images already loaded and annotated on this platform. Now, if you’re doing this manually image per image, that can take a long time and sometimes you may not have all of those images readily available.
So what our platform allows you to do is to upload limited amount of data, and then use the additional tools to generate larger amounts of data to be used for model training. And just to give you a reference with these 1,700 images that are already annotated and produced here, we only use 30 real images, one 35 second video clip, and one CAD file. And with that, we’re able to do things like generating synthetic data. So 3D synthetic data, you would upload your CAD file and then a material file with it, and then Chooch would be able to apply either your specific backgrounds or we have generic backgrounds that we could apply to it, to then generate vast amounts of data. 2D Synthetic data is basically once you annotate an object, you can then apply your own backgrounds and themes, and then Chooch starts randomizing and making additional images from your data already.
And then we have things like smart annotation, so that’s going through and automatically labeling a lot of these. So if you already have, let’s say 30 aircrafts, you can go through smart annotation and be able to automatically let the system annotate all those aircrafts for you. And then the last thing is I call it the knockout punch, is using augmentation. What augmentation will do, it’ll take all those images and then apply either rotational or horizontal flips, then start adding additional, basically shifting scaling rotation, noise, blur, and brightness, and contrast to the images that are being generated, to allow for different environmental considerations. Now, just to show you what our annotation tool looks like, I’ll go into this image real quick… And here you can see this is going to be a no-code approach to labeling and annotating. So all we’re doing is taking this tool and actually drawing our bounding box around this aircraft.
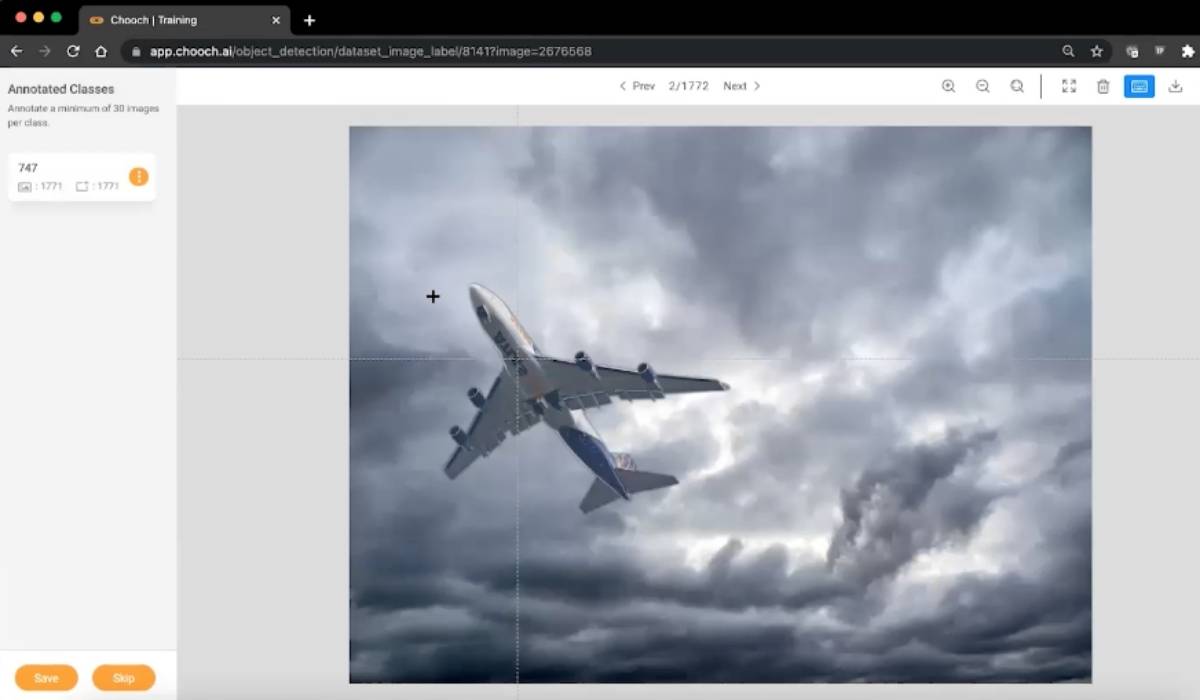
So we can just click drag and draw, and then we can label it as a 747, and once we hit save, you’ll see this number actually increase. Now we have 1,772 images, as well as annotations. And just to give you an idea of what the 2D synthetic looks like, so this aircraft is labeled and facing the left. Now, if I go to the next image, you’ll see the same aircraft is just resized facing the opposite direction with a different background now applied to it. So these are the ways and methods that we’re able to now generate larger amounts of data, so you can create a strong model. Now, once your data is annotated and ready to go, what you can do is just hit, create model, give it a name and then hit create.
And once we hit create, Chooch is going to take this internally and start running through and building a model for us. So now what we can do is once we have these models developed and they’re built in-house with your annotations and your maybe data scientists applying their knowledge into it… And again, this can be anything from detecting objects or detecting anything from, let’s say, cancer or bacteria cells on X-ray visions. So it’s basically taking the expertise of an individual, like a doctor, and applying it to the AI. And once we build the model, then you can go to your devices.
So in creating the devices, very simple and easy, as long as you meet some of our basic criteria, you’ll see here, you’ll be able to run on Ubuntu and Red Hat, you’ll be a select your GPU, and then if you leverage MQTT for machine-to-machine communication, you can also do that, so when we generate any detections, we can send it to that MQTT broker to then distribute as you have defined it. So in this case, we already have a device created and we’re running on a T4 GPU. And when we come in, we can now apply different streams. So adding a stream is fairly simple, you’d hit add stream, give it a name, and let’s call this… Airport runway, and then you would give it an IP. We’ll just give it a blank IP here, and we’ll hit add string.
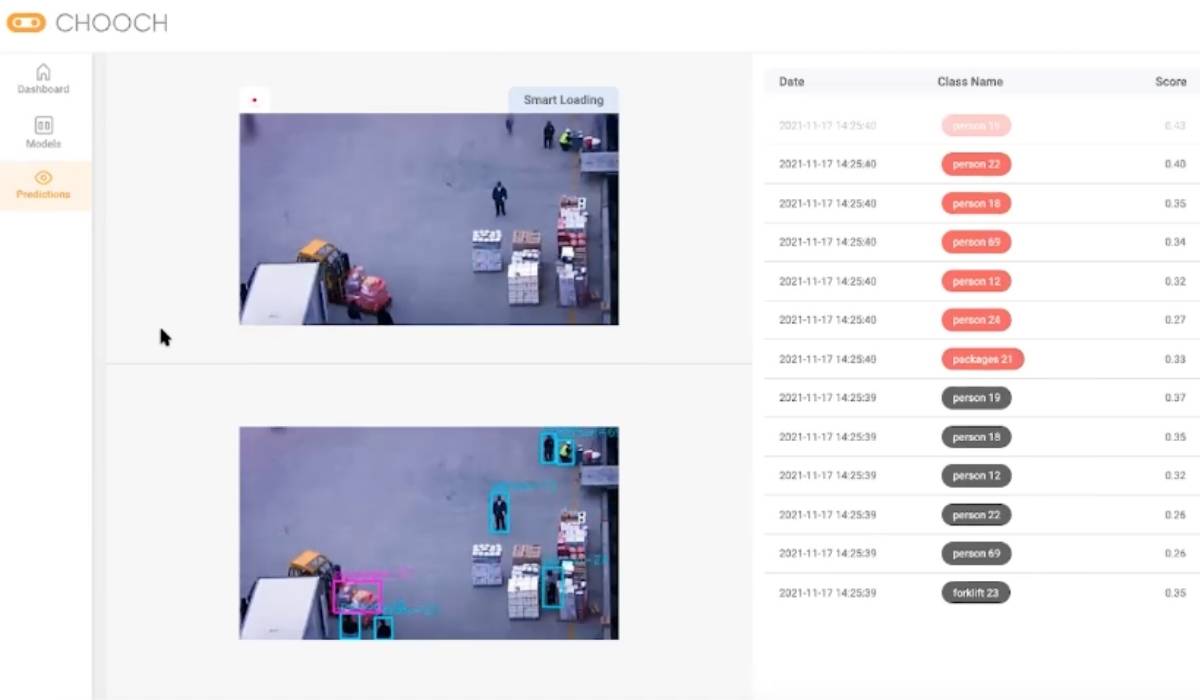
So now this new stream data has been added. And then you can go into this stream and apply a model. So if we go into one, like our smart loading example, we already have a forklift custom model built, but if we wanted to, we can add additional models to it, so we’re not limiting you on the amount of models that you can add per stream. So let’s see what this actually looks like. So this new screen I just came into is our edge dashboard. This edge capability can be in your private cloud, it can be on premise, or you can also leverage our cloud as well. Now here, you’re seeing all the different people, forklifts, boxes, and packages being annotated and detected here, and you’re seeing everything in red. Those are all the current objects and people that are being detected. Now we want to take it to another level and apply some additional analytics to this. So if we come back to our dashboard here, we can go to our analytics settings…
And here’s where we start defining our different classes and groups. So now we can additionally group person and forklift together. So you can create a group like we have done here, and then we can go to our zones tab. So these are all like Peter was mentioning earlier, we can annotate different zones. So in this case, on our zone map, you can see we have an unloading zone and then we have a loading zone. So once you use, and it’s the same tooling that you saw before for doing the annotation, it’s just a no-code approach. We can then go to rules. So in this rule, we have defined danger zone. So it’s a person, forklift, and the unloading zone together for more than one second, then we will generate an alert. So if we go back to our devices, what users can additionally do is be alerted either in real time, or select a different frequency.
So here you can see that I’ve applied my email to this alert and reports email, and frequency, you can do either real time, you can do end of hour, end of day, end of week, or end of month, and then you can include the alert images in those as reports as well. So if we go to our analytics tab now… Navigate here… What the system will do now is gather all of the alerts that it has detected, and be able to show us in a graph format or in pie charts, right? And as Peter mentioned, and you can start toggling and applying different filters, so if you have an incident and you want to drill down to say, “Hey, I need to go back to this day, at this hour, on this specific camera,” you can now filter that and quickly access some of the analytics behind it.
So here you can see the pie charts with all of our forklifts, our smart loading… And then if we actually go to alert images, you can actually get a snapshot view of some of those alerts that have occurred. So in this case, in our forklift danger, we have a person that’s very close to the forklift and one of the zones. So we’re able to highlight that as well. And what this would look like in the email, if I go back here, you go to our emails, you’ll see that in the email, you can get an alert for the specific device, the stream, the date and time, as well as some of the rules that were triggered here. And then you’ll get again, the snapshot of that incident or that alert or that rule being broken. So with that, I will stop sharing and hand it back over to Andrew.
Andrew:
Thanks Omid, and thanks to our entire Chooch team for the efforts on those updates. Now, we will open it up for Q&A. We’ll take a brief 30 seconds and let everyone enter any questions on the chat below, and we actually had a couple that just came in and we’ll kick it off and as questions come in we will tackle those. So our first question is, how long does a typical model take to develop?
Omid:
Yes, I can go ahead and answer that one, Andrew. So typical models can vary on timelines. That variation can be on the amount of data being supplied and the complexity in which we’re tackling. Now, traditionally, a typical model can take between six months to a year to develop, but with the tools that we show today, you can rapidly develop models and being very conservative in a matter of a couple of weeks. And that’s with a lot of testing being done and making sure that the accuracy is where we would like it to be. That’s a good question.
Andrew:
Yeah, great question. Great question. Another question we have regarding models is, do you all build models or provide just professional services?
Peter:
I can go ahead and take that one. So great question as well. So we provide either two options here, either we can provide the services for you to do the development and training of a model. We can also train the trainer where we can help provide mentoring or consulting services to use the platform, or the platform as itself, as you saw from Omid’s demonstration is with a little guidance and documentation and self explanatory, where you can potentially do the model development yourself as well. So depending upon the business model and the needs and how complex use cases, we can enter either all three possible pursuits. Thank you.
Andrew:
Awesome, thanks Peter. Another question regarding the private cloud, can you be installed on my private cloud?
Peter:
I’ll take that one as well. Our solution is very flexible in that it can be deployed a hundred percent in the cloud, or there could be also what we call the edge component OnPrem, but the edge component can also deployed in your cloud as well, so we’re very dynamic to what can deployed and where it is. We can try and explore that further based on exactly what would be the required compute and things like that.
Andrew:
Exactly. Thanks Peter. This one’s regarding alerts. Funny timing, right after you Peter, does our platform have the ability to send out SMS alerts, not just email alerts?
Peter:
Yep, and I’ll grab that one as well. So in addition to email and SMS, be it reports or alerts, we do support MQTT integration as well. And so that’s a standard within the IoT or OnPrem interface and industry, so we can integrate to an MQTT broker and then provide our predictions via JSON or things like that. Thank you.
Andrew:
Awesome, thanks Peter. Another one that we have here is how many public models does Chooch currently have available to customers? So I can kind of tag this one, we have over 250,000 models and it really comes down to, with our team, with the rapid model development. That’s how we have come to this number. I think we got time for maybe a couple more here as we keep going through here. Oh, someone’s done their homework. You did not mention anything about the IC2 app. Can you talk a little bit more about the IC2 app and how it connects with public models?
Peter:
One minor correction to what you just said, Andrew, it actually classifications or annotations. So that means, hey, we’re able to look for smoke, car, wave, boat, et cetera, but we have upwards about 80 different models, varying from image, object detection, facial detection, and also text detection. We have up to 250,000 different type of classes for those detections. Going to your second question there, Andrew, thank you for that in regards to IC2. So the IC2 mobile app, be it for Android or Apple is a way to demonstrate and test out our general deep detection, analytic, or model we have in our solution. And so what this does is you’re providing a camera interface, looking at different things. My picture on my wall here, myself, or another person next to me, it’s providing images up to our cloud and we’re providing general detection looking at a person’s gender or age or sentiment or things like that. So again, it’s a way to test out and demonstrate the power of our product.
Omid:
I just wanted to add to that with the IC2, we’re constantly developing and iterating on it. And now what we’re also able to do is annotate on the fly. So you could be out in the field somewhere and you need to make an annotation. You can grab an image of it, annotate it, and it’ll actually get pushed up to your cloud dataset. So in your dataset, you’ll have an actual tag there for your IC2 app, and then all the images that you annotate on your phone through the IC2 app will get generated there, so you can incorporate that into your larger datasets.
Andrew:
Absolutely. And thanks Peter, for the clarification on that one. We got time for one more question here. Does Chooch AI offer pilots to companies, and how long is a typical pilot? We can kind of tag team this one. A pilot or a kickstart can vary anywhere from weeks to months, but the short answer is yes, we do offer that, and would love to talk to you more about how this works with you and scope this process with you. Absolutely, we do. Any team members have anything else to add on that?
Peter:
Yeah, and I’ll jump in there as well. And again, the pilot is dependent upon the use case, the model to be developed, and just also how ROI or return on investment is measured on that. But ultimately it’s on a case by case basis, and within the timeframe kind of what Andrew budgeted there.
Andrew:
Absolutely. Well, we are our running short of time here. We try to get to all the questions. Those that we did not, we’ll try to get back to you via this chat. Thank you all for joining today, and please feel to reach out to us at chooch.ai, and we look forward to communicating with you and answering more of your questions. Thanks so much for joining us today, have a great rest of your day.
Peter:
Thank you very much, everyone.